🐋 InsightWhale
I am running a conversion rate optimization and digital analytics agency - InsightWhale. Most of my friends (and also my mom) still don`t understand what we are doing here and I think this post can be pretty descriptive for my little audience.
In previous posts, I mentioned, that I am running a conversion rate optimization and digital analytics agency - InsightWhale. Many of my friends (and also my mom) still don`t understand what we are doing here and I think this post can be pretty descriptive for my little audience.
What the heck are these CRO and DA?
So, DA stands for Digital Analytics, and CRO for Conversion Rate Optimization - two things that are tightly linked. I do not want to post definitions of these terms, because you can google them yourself. I will try to describe what are DA and CRO, just by giving you an overview of what we are doing daily in InsightWhale from Monday to Thursday (yup, it is a 4-day work week😎).
I bet most of you have bought something online at least once, and that the vast majority constantly surf online stores to buy clothes, supplements, gifts, etc. Some of you may also be into self-education, like me, so digital products, like online courses and training programs, are common things for us.
When you are scrolling through some e-commerce store on the web or clicking "join" while going through some info product landing page or creating new task in productivity application on your smartphone - everything that happens during your visit to this website/app is tracked (at least it should be).
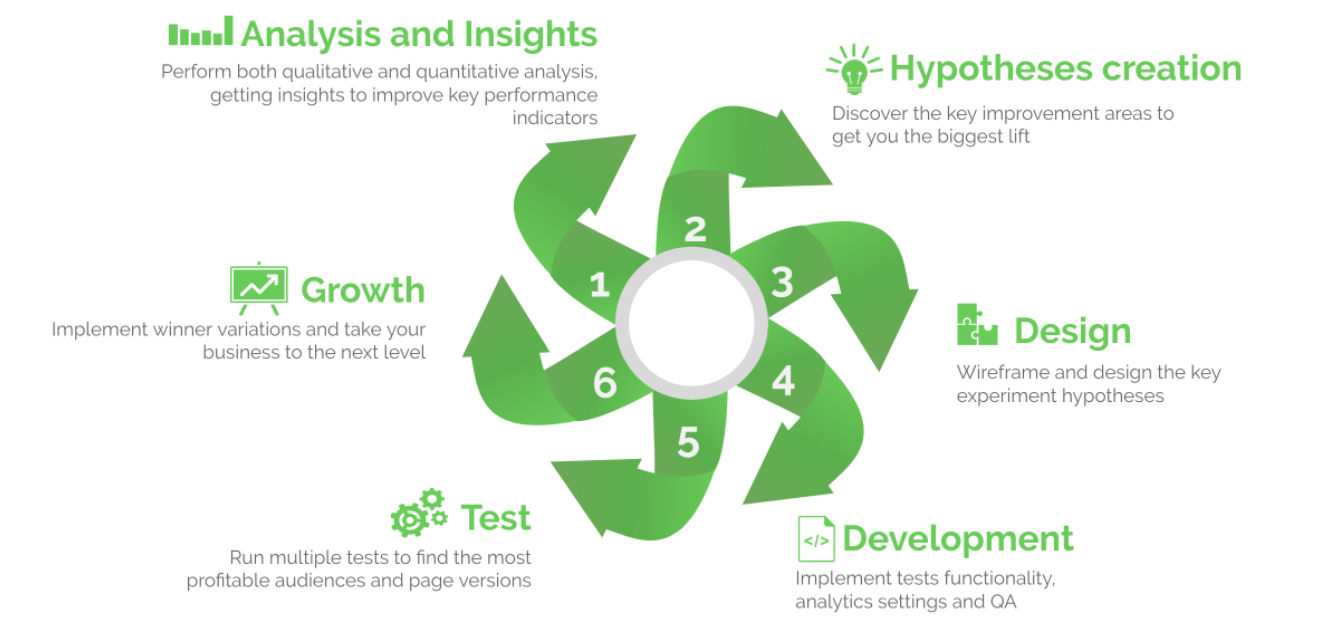
Agencies like InsightWhale analyze your activity = data points, then try to find some insights, and prepare a list of ideas (we call them hypotheses). These hypotheses can enhance the experience during your user journey. We test suggested ideas, most of them convert into an uplift of desired metrics of this website/app and, eventually, get this business additional revenue. Simple, as that.
Best start - mind your tracking
First of all, we need to make sure, that everything on this website/app is being tracked correctly and that data is accurate. The most common tools for tracking now are Google Analytics (we can also include Google Tag Manager and Google Data Studio), Amplitude, Appsflyer, Segment, Mixpanel, and others. Our Digital Analytics Experts can audit the configuration of these tools and then come up with a tracking plan. The tracking plan is a live book, where each and every event, goal, and best practice is described in all detail.
The main goals of creating digital analytics tracking core are:
- have up-to-date info about the current status of the analytics implementation
- to make data easily accessible, as the tracking plan describes what is set up in the tool
- take notes of any changes to avoid inaccuracy in data representation and interpretation
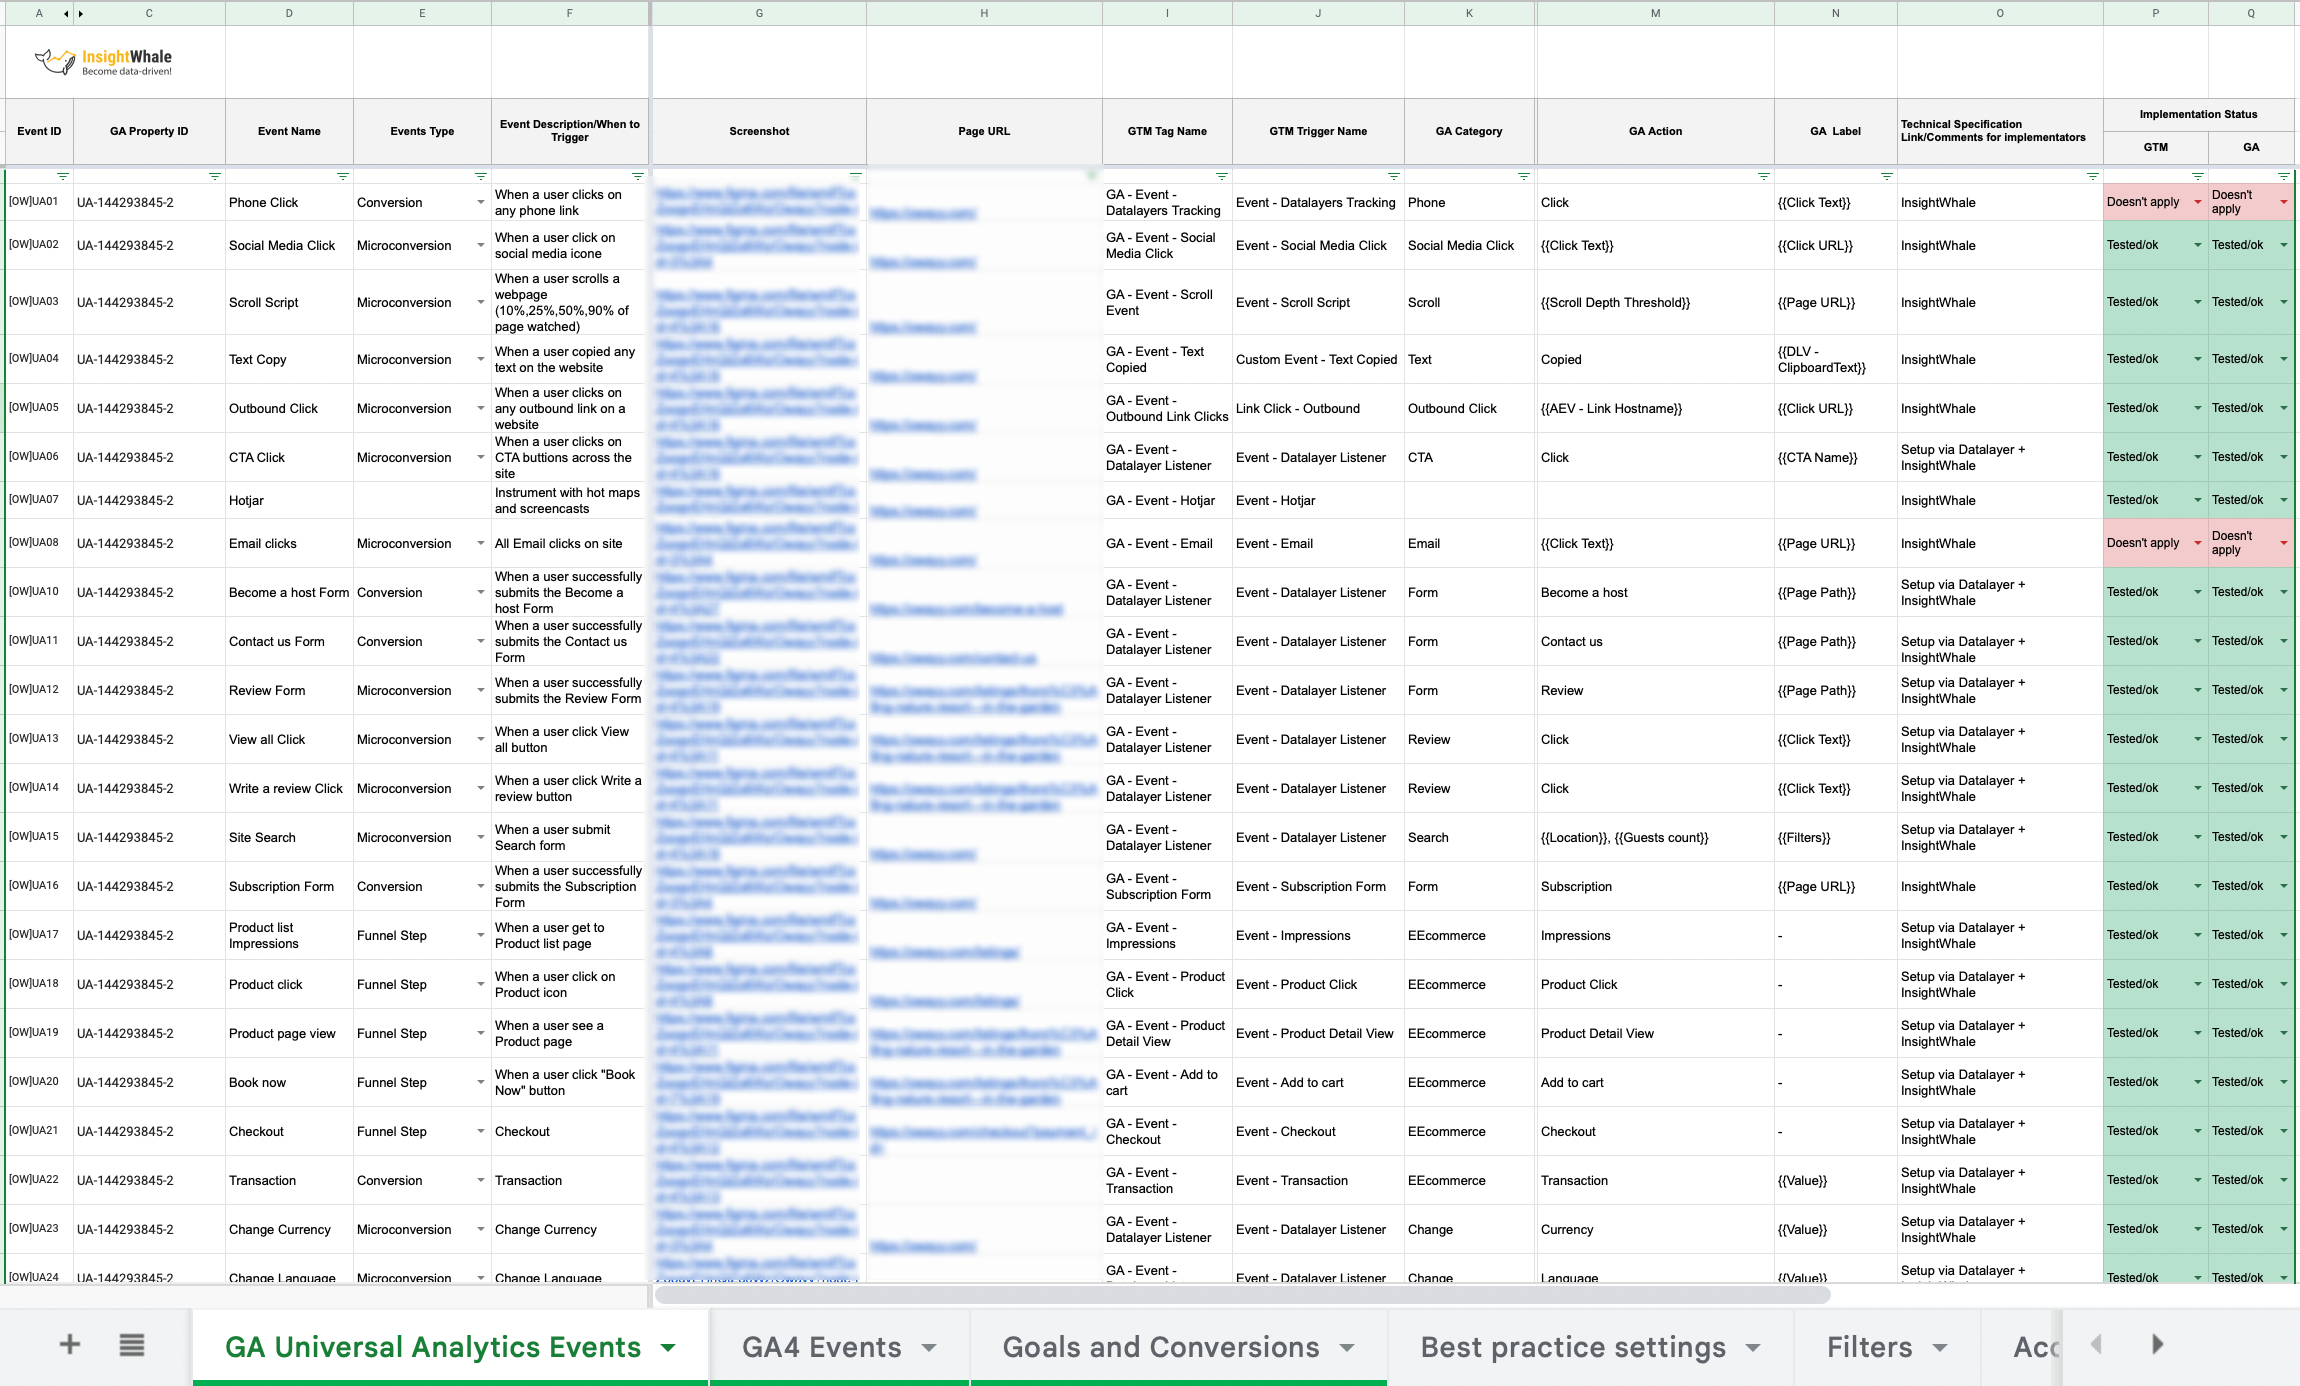
Once the tracking plan is ready, DA (digital analytics) team starts the implementation itself, there are different ways with which you can set up tracking, we choose the best one possible in a particular project and go ahead. Our work ends up with the quality assurance of the tracking (we check whether everything is firing, as it should on each and every device, operating system, etc) and then Whales present you what has been configured and how to use this data.
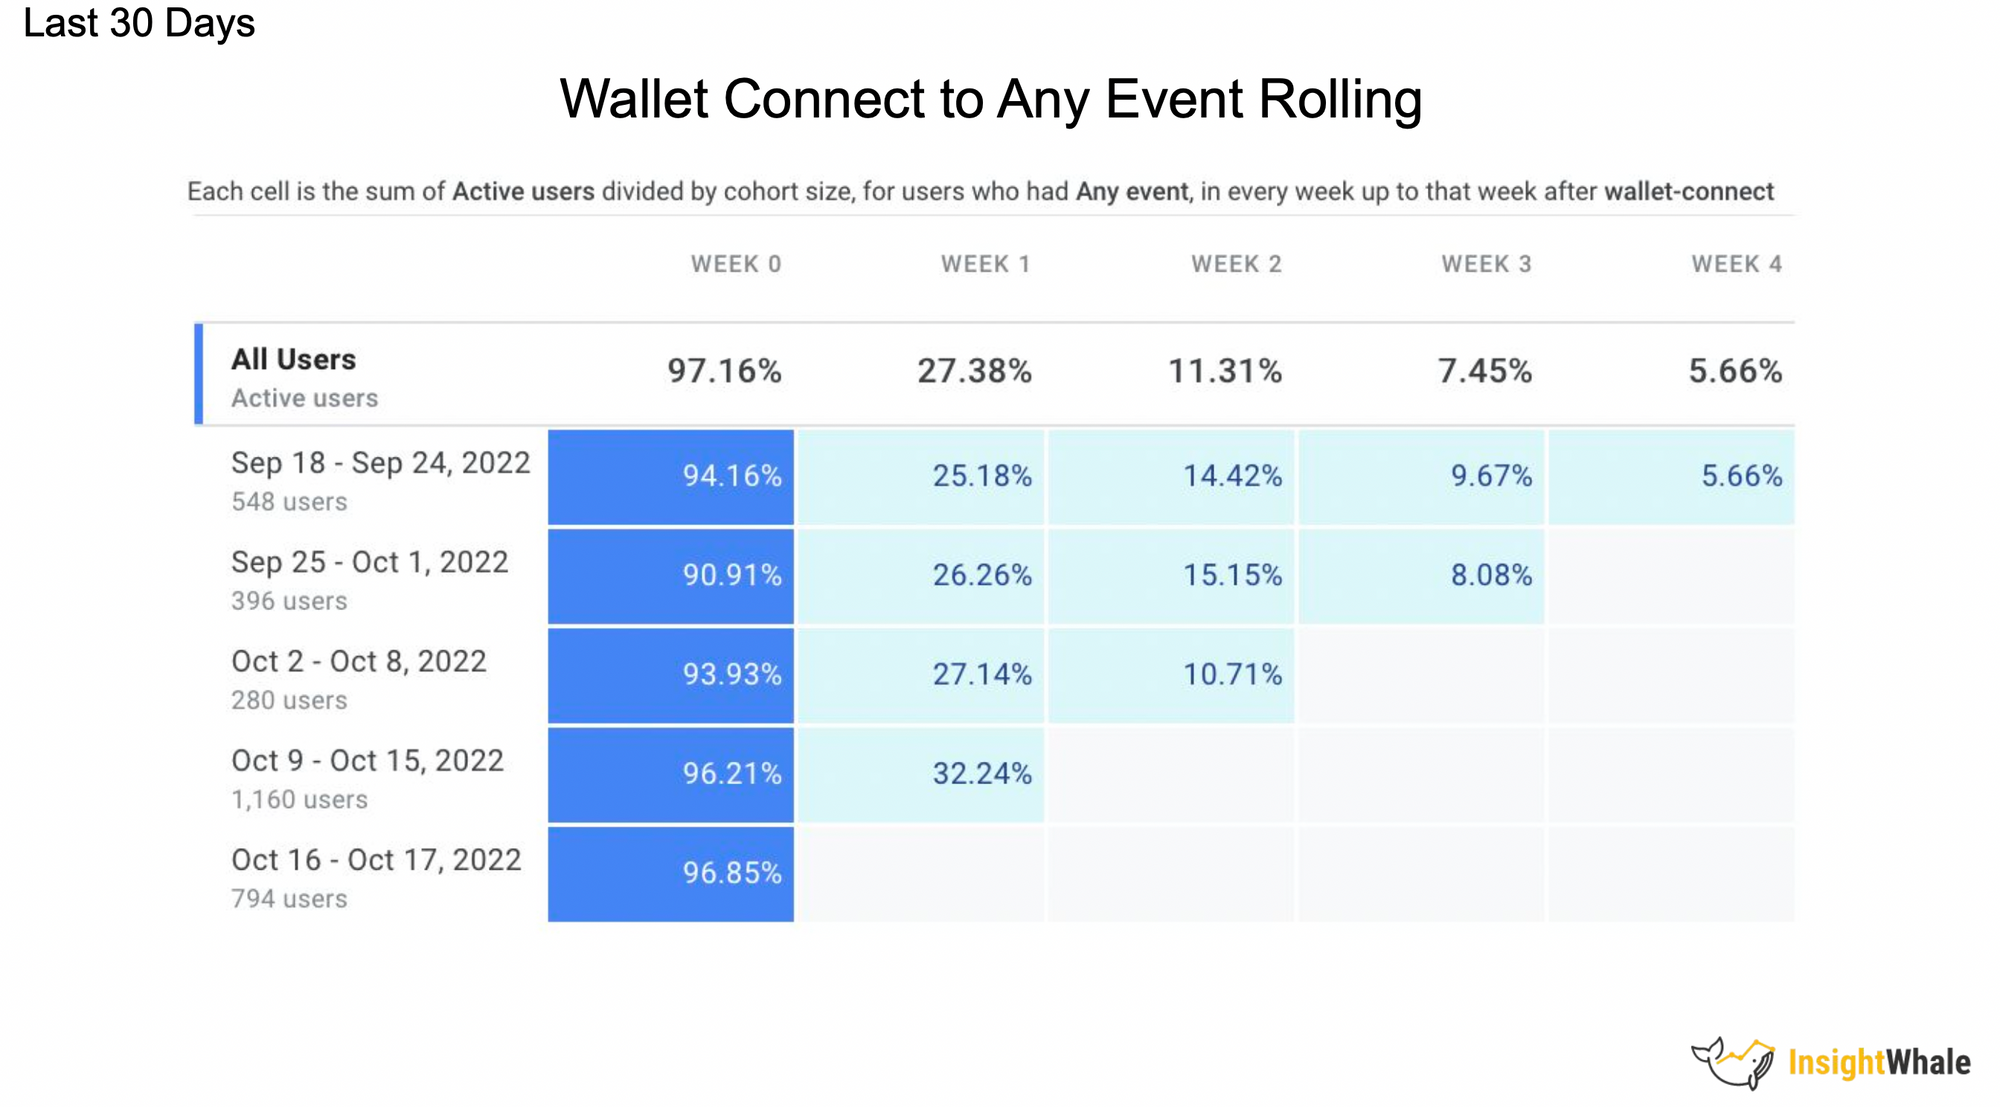
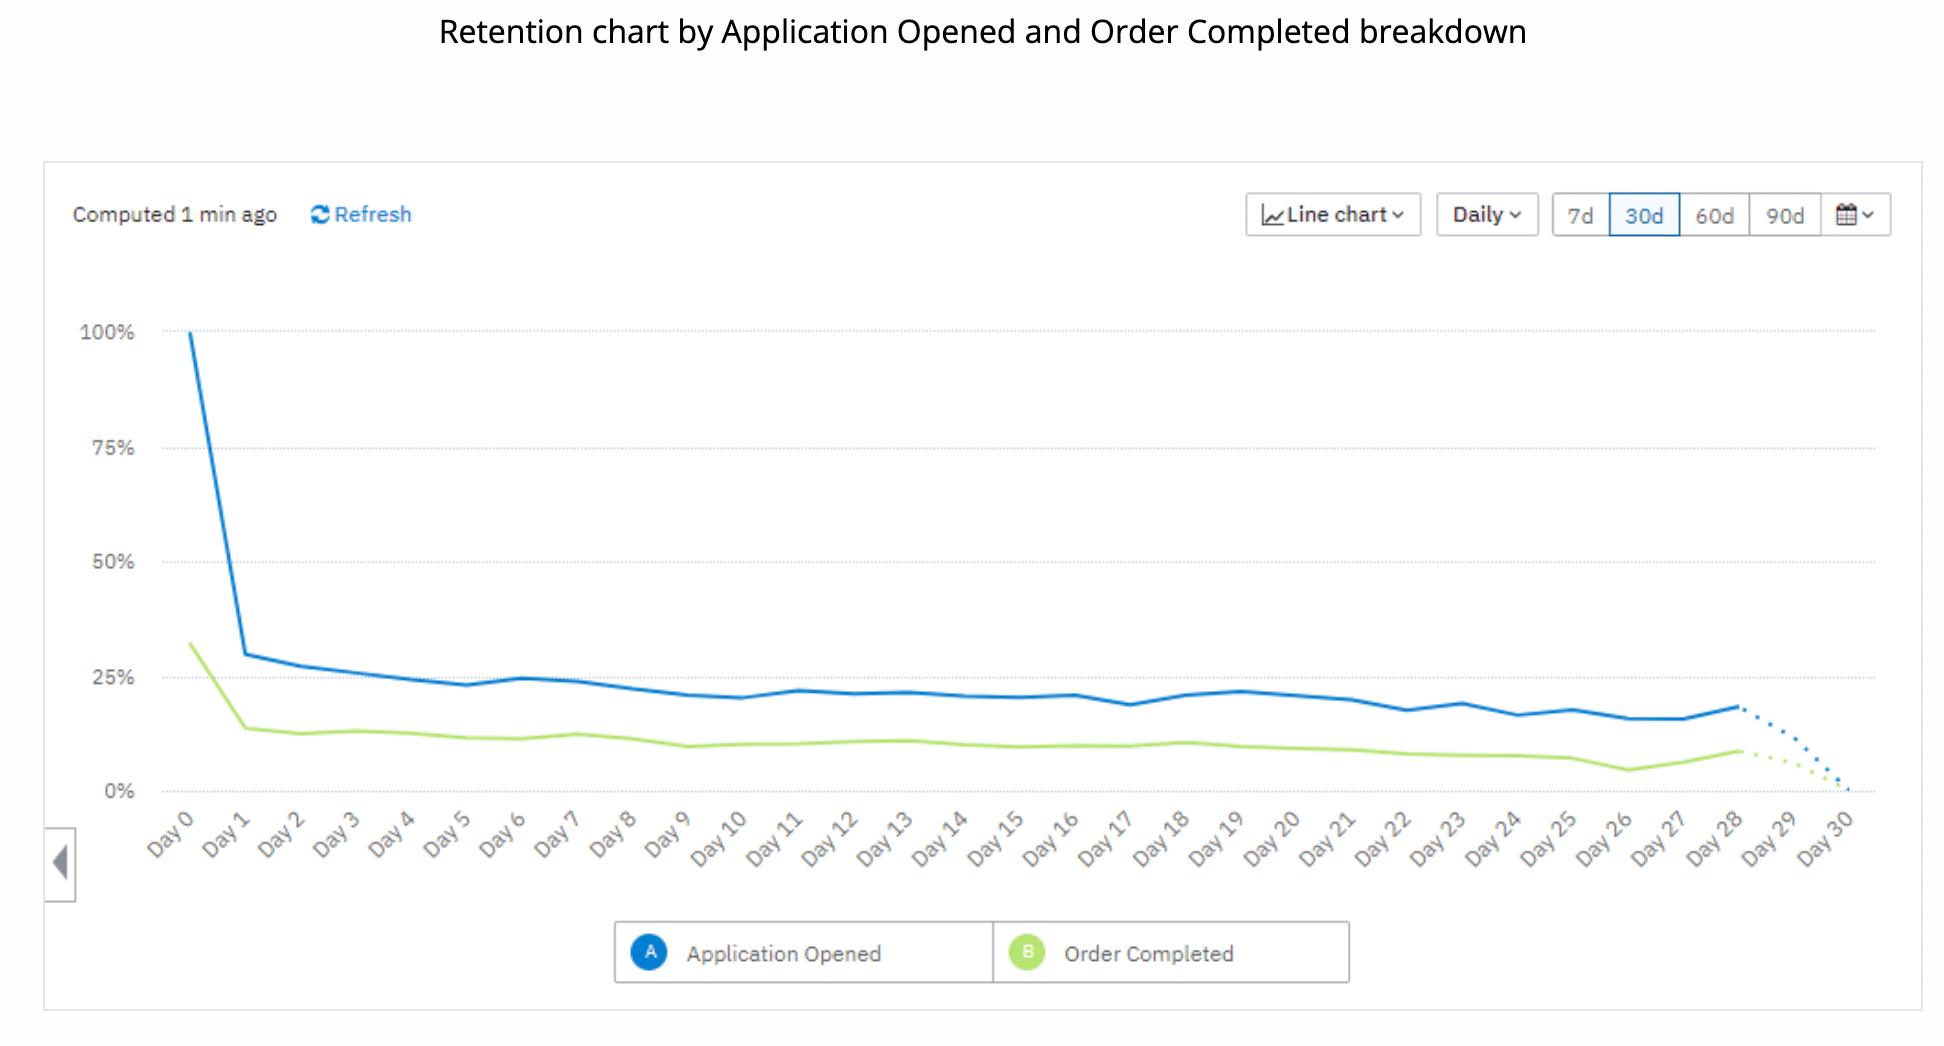
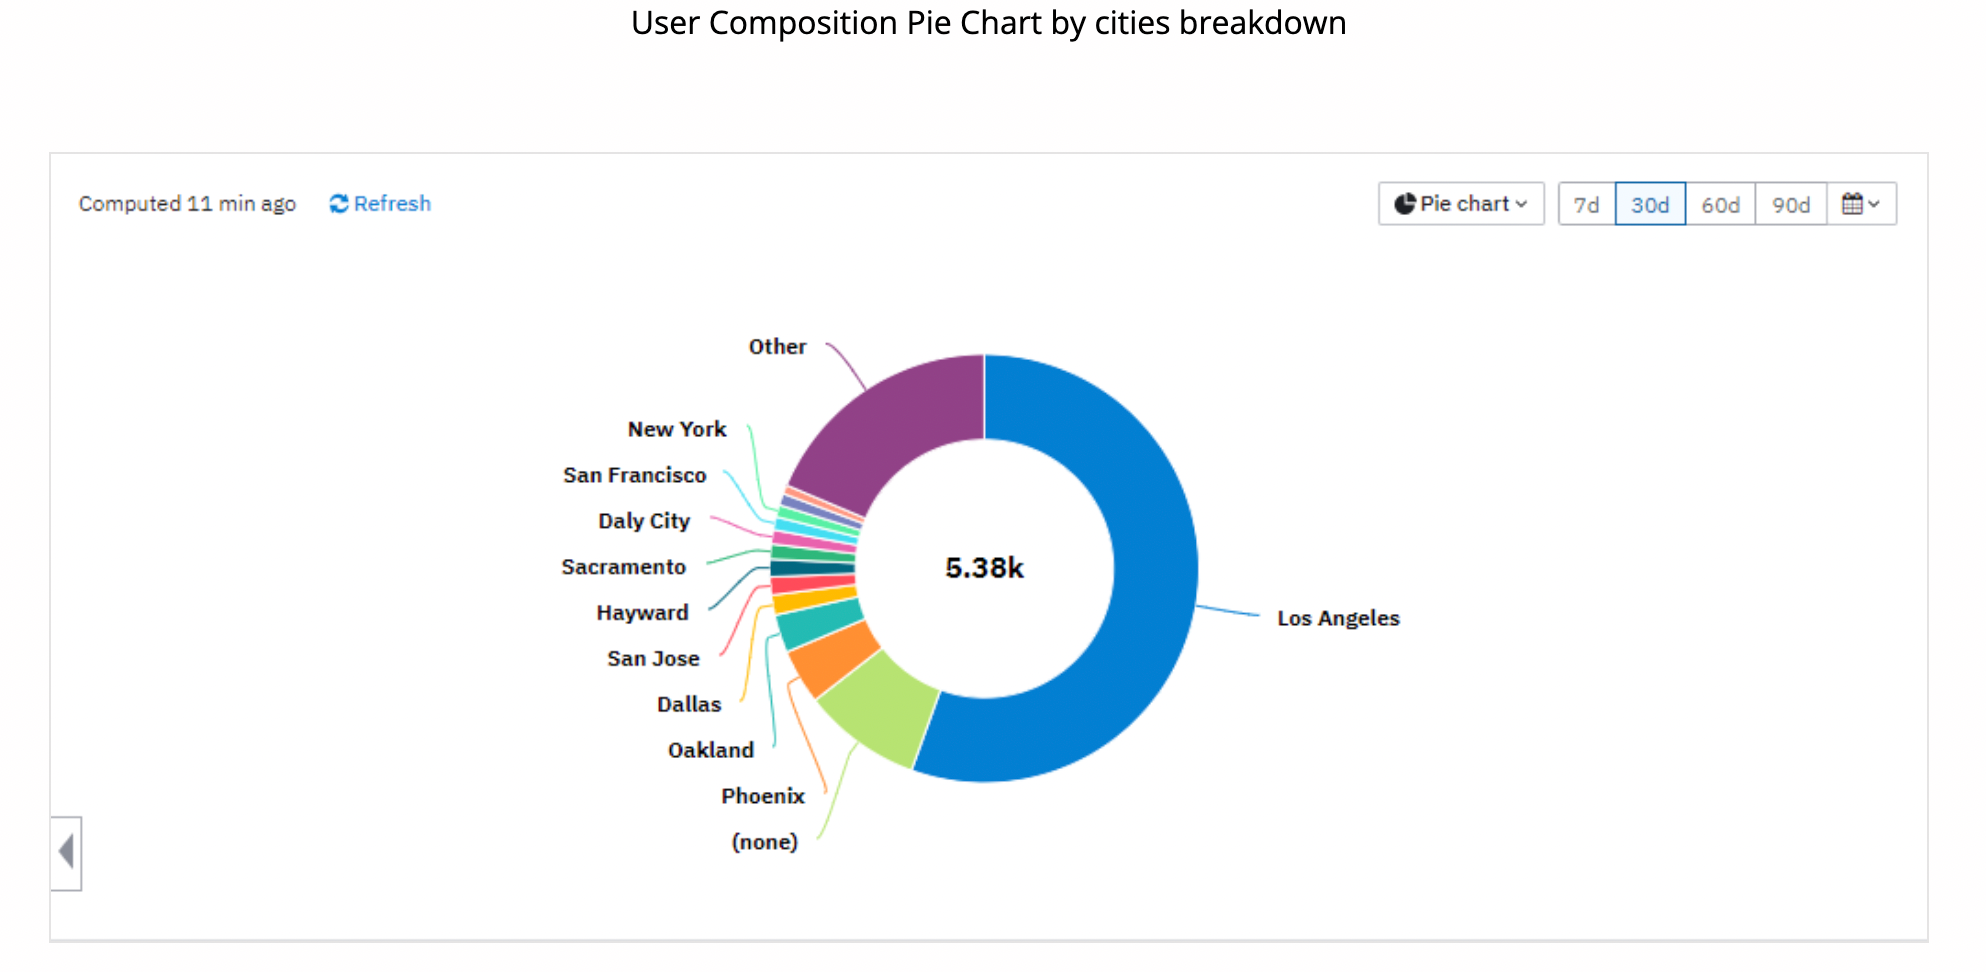
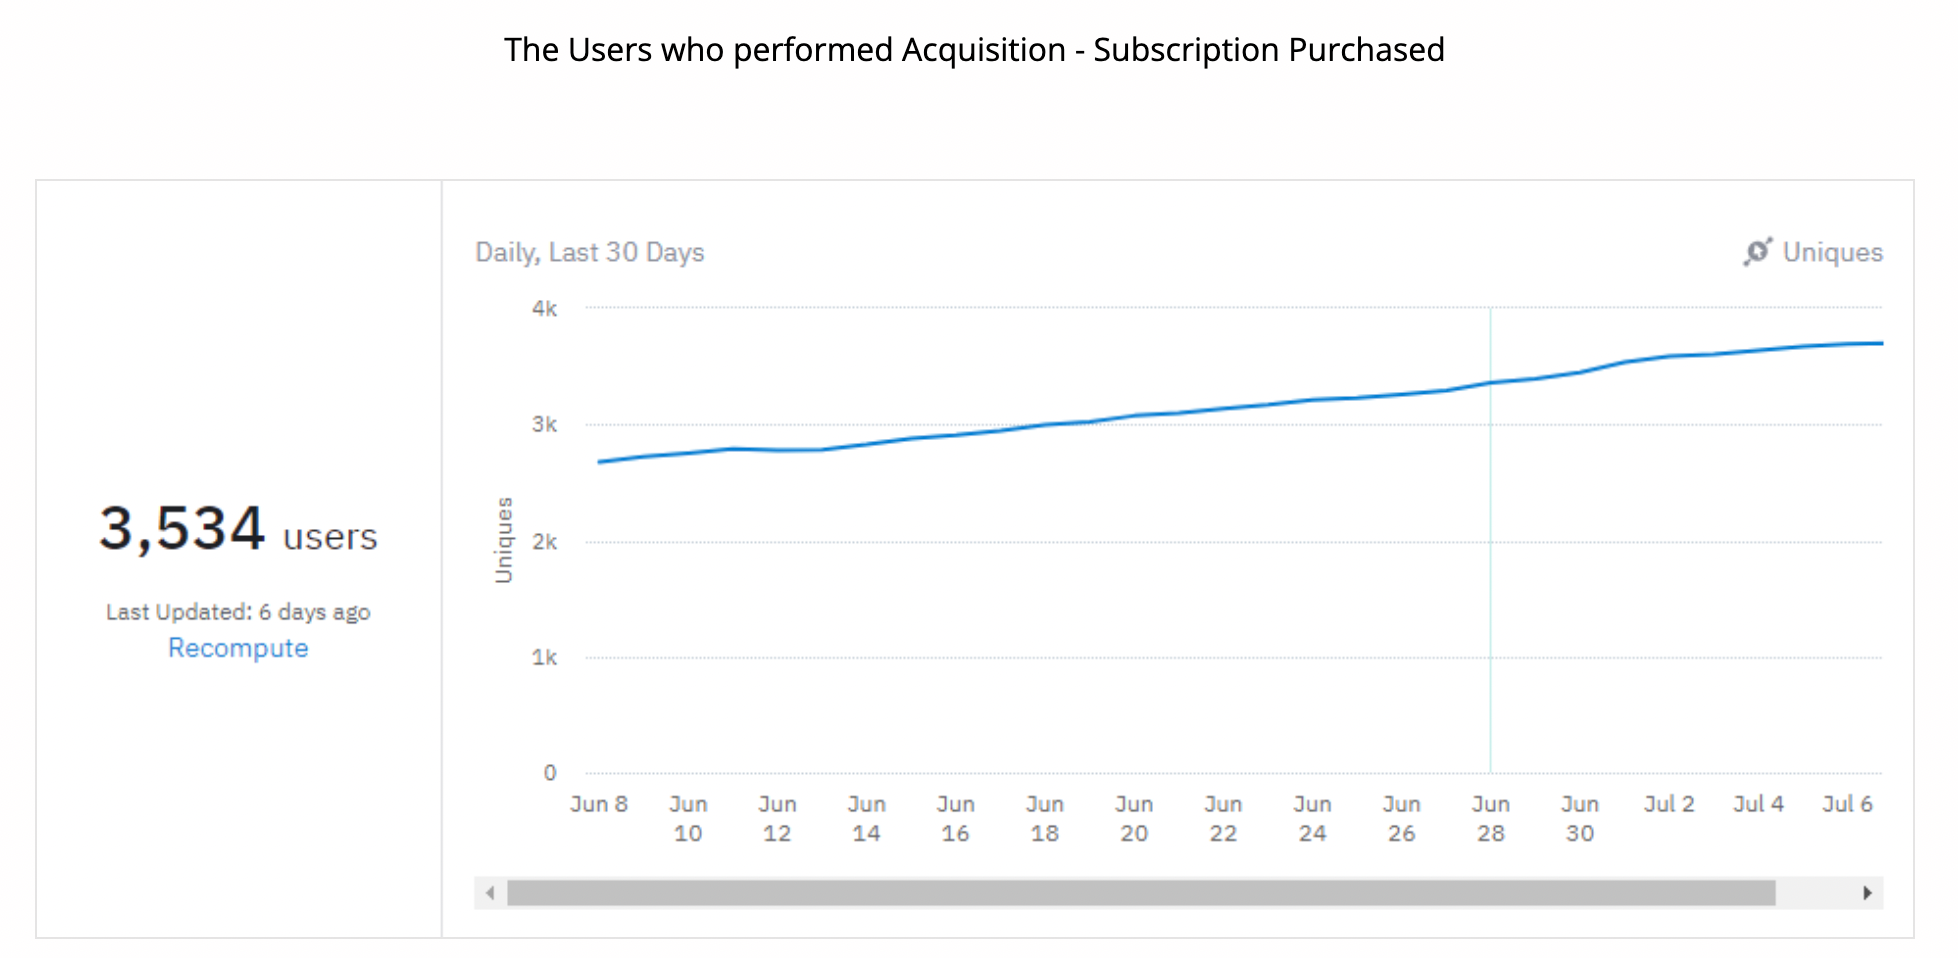
Some examples of what our clients get after the job are done:


Next step - consider testing
InsightWhale team firmly believes in the data-driven approach, in that sense, when we get some reliable analytics tools in our hands, our CRO team can dive deep into what is going on with the metrics and come up with certain tactics. These tactics can ease the process of going through the funnel for visitors of this website/app and make the whole process convenient and pleasant, which results in getting more cash flow coming in for the business.
In new articles, I will share with you what the analysis process looks like and what is the output, and also, how we do A/B or MVT testing.
I would like to finish this post by sharing with you one of the great results we were able to achieve for our client recently, so you could see the value we provide, not just some mind-bending chatter.
+$12,000 per month for fashion apparel store with a single test: just exclude distractions and move up that button
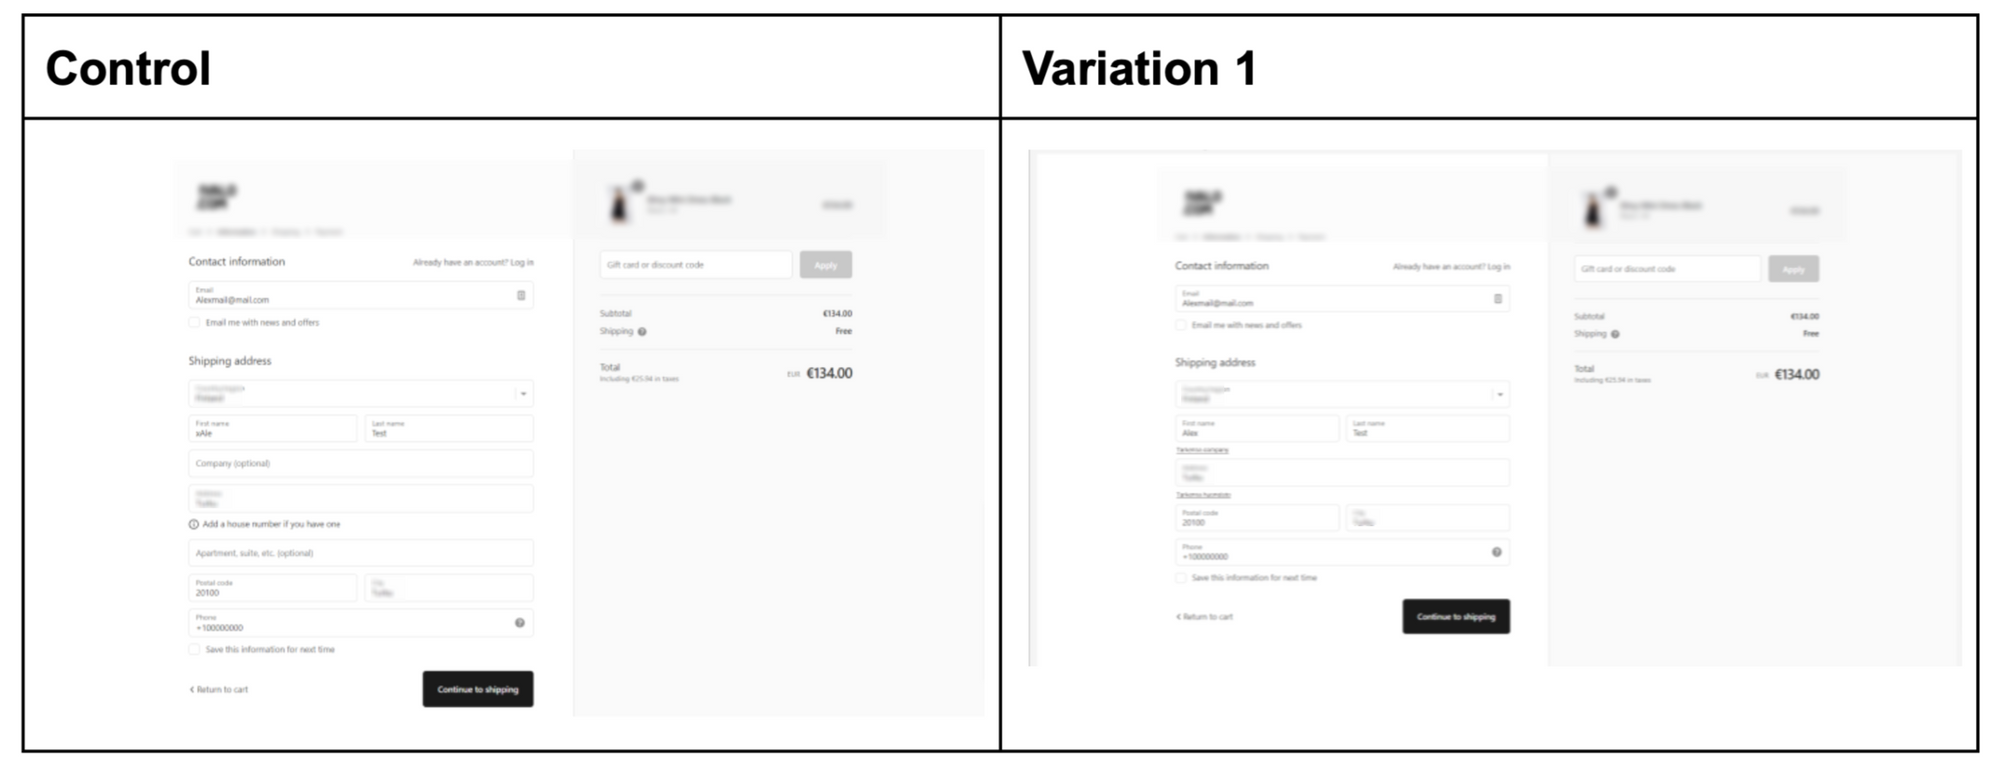
When our CRO team was going through the heat-maps data in HotJar, they noticed most users of this Shopify store don`t see the main button at this step of the funnel, as it is above the fold.
Here are some screenshots:


It was also evident, that some fields in the check-out form were less popular and in fact, they were not bringing anything to the table except distraction.
We suggested making those fields optional by adding a drop-down button:
Our hypothesis was that by making unpopular fields collapsible, we can raise the button higher due to the freed-up space and thus increase the conversion. It turned out to be true, here are the details.
Test was running for 24 days and got more than 1,000 users engaged in it.
Here are the control (the current version of this page) and the variation (our suggestion):
After 24 days of testing we got some great results, variation was performing significantly better with the uplift of almost 10%:
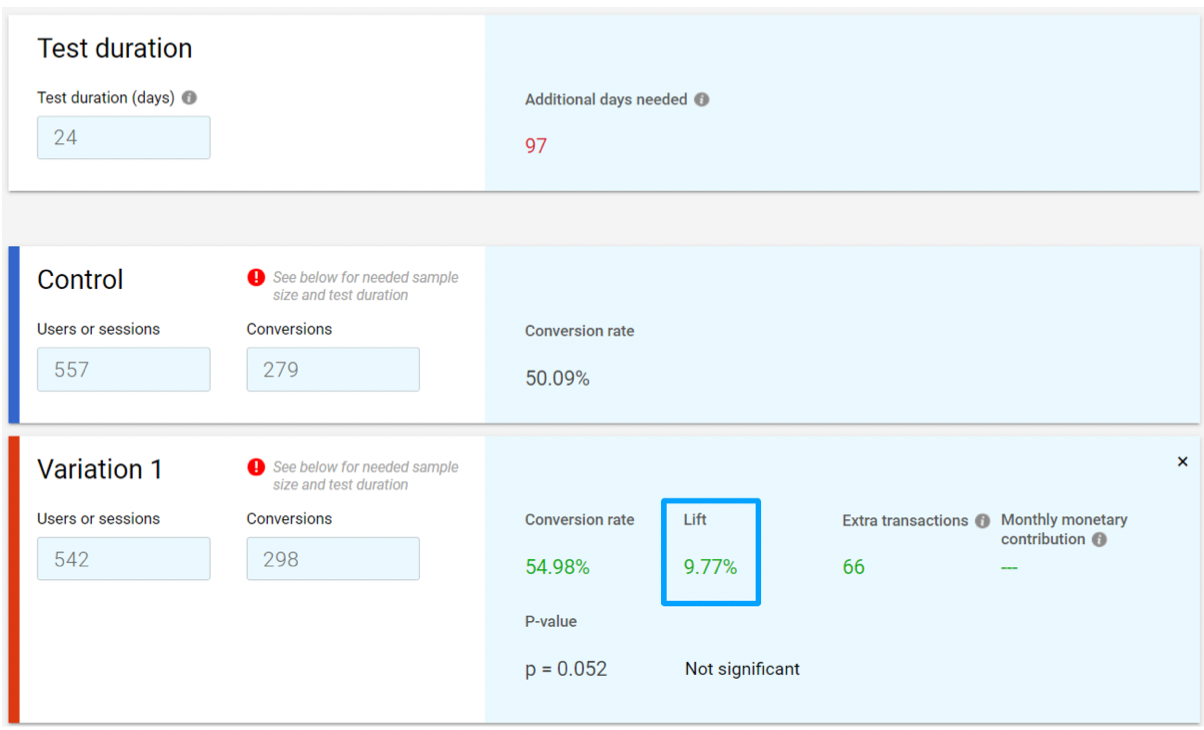
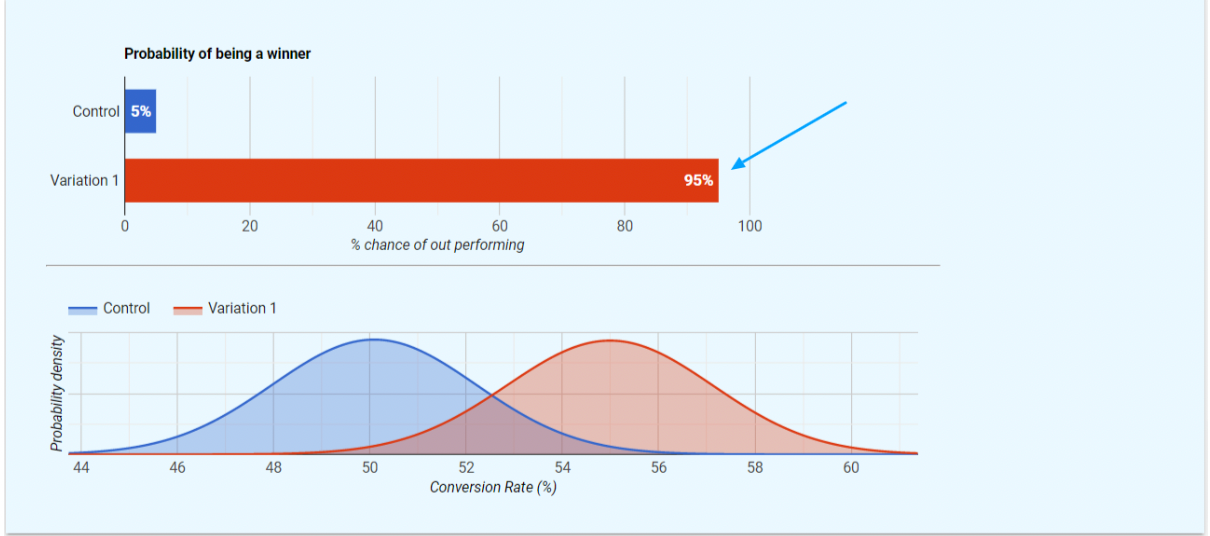
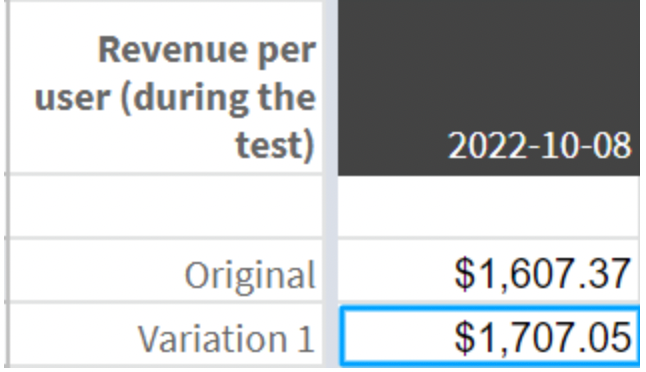
When our client implements those changes to the production of website (where all traffic lands), just by making one field of the form optional, this store will be getting an additional $12,000 each month, which means almost +$150,000 a year.
Thanks for reading out this post, it was not a quicky😂. Please let me know if you liked this post or would love to know more about conversion rate optimization and digital analytics. Hope this one was interesting for you, I will be expanding on this topic going further with new content pieces. Have a blessed week ahead!


